Gap Analysis Templates

10+ Free GAP Analysis Templates & Examples (Word, Excel)

A GAP Analysis explains the difference between the expected performance of a business, its operations, and the actual outputs of such business. Further, a GAP Analysis shows that a system is performing below the general standards. It may be compulsorily to check it for optimum performance. As the name implies, in an everyday language, it shows that there is a gap to be bridged. In the analysis, operational and structural deficiencies are identified and studied, and the required procedures are needed to rescue the business and get it going at its best. GAP Analysis can also be used by project…
Biography Templates

Biography Templates {Personal & Professional}

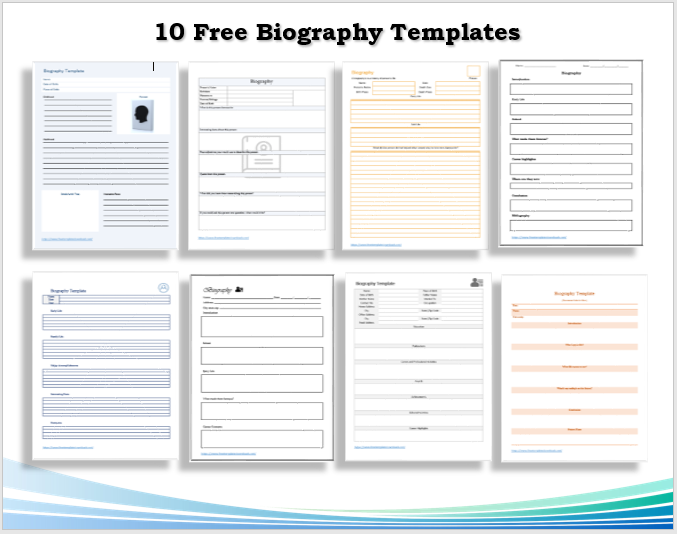
Every professional person needs a bio, but very few of them can write a good one. It’s becoming important because most of us cannot be bothered by reading lengthy documents and profiles of any person. Hence biography is needed. It is important in many ways i.e.in finding jobs, publishing an article, or any social network. Biography templates help enable you to write the biography of a person in a pre-formatted professional format. You can start with a blank document, but it will consume your time in creating the format and structure of the document. Instead of that, if you use…

Organizational Chart Templates

Organizational Chart Templates or Organograms are representations of the hierarchy of power within the organization. In other words, it is a diagram used to show the flow of power within an organization. An Organization Chart always starts with the highest authority and trickles down to the one with the lowest authority. Preparing an organizational chart should be done with so much attention to detail. This is because a small mistake can result in so much damage to the reputation of the authorities involved. It can also result in confusion during consultation in case of assistance is needed. Keep reading to…
Gantt Chart Template in Word

Gantt Chart Templates [Free MS Word and Excel Design]

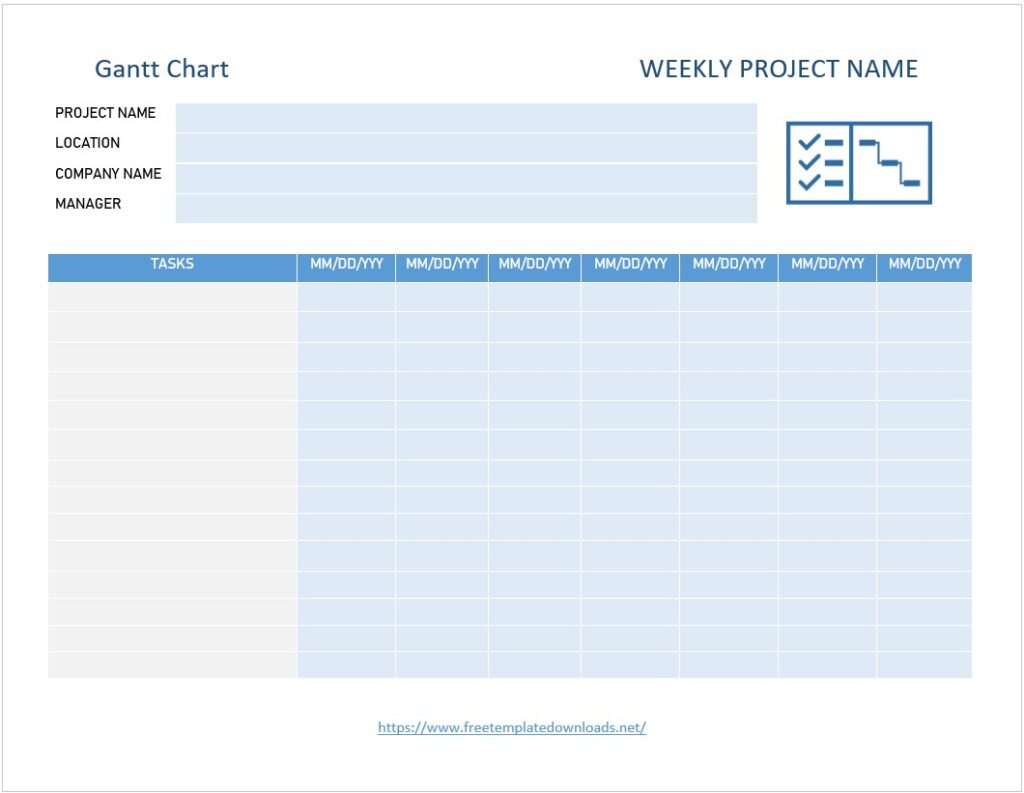
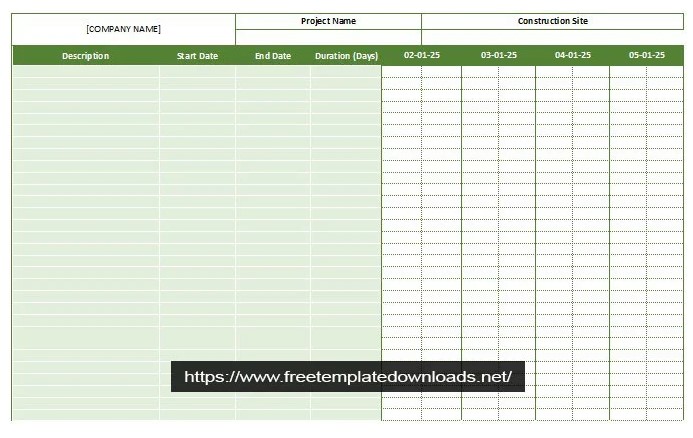
A Gantt Chart is a tool used for project management. This is most often used when having to organize many different tasks associated with that project. Gantt Charts are bar charts that show how much time it’s expected to finish a particular task. It is very important for a project. It also shows how much time it takes for those tasks to be completed. With the help of it, you can see how the tasks relate to each other toward the completion of the project. This not only helps people know when they should start their work but also lets…